10.4 ENGINE SYSTEM INTEGRATED PERFORMANCE CHARACTERISTICS
In the process of engine system design integration, an important task is the integration of engine system performance characteristics. These data are prepared and compiled by the rocket engine designer to provide the vehicle systems engineer with information necessary to integrate the propulsion system with the vehicle system. Where possible, a brief explanation of the data and its application should be included to provide clearer understanding and greater usefulness. The following are important aspects of integrated engine performance characteristics.
Nominal Engine Performance Values at Rated Conditions
These are usually prescribed by the engine model specification. These data are for engine system nominal steady-state operation, at rated conditions. Tables to are typical examples of nominal engine operating and performance parameters, which include nominal thrust, specific impulse, propellant combination, flow rates, mixture ratio, and various component operating data. Allowable deviations are specified for important parameters such as: thrust, percent, and mixture ratio, percent. Engine system specific impulse is usually specified at its minimum value. The performance of all deliverable engine systems must be above this minimum during acceptance tests.
In addition to tables for nominal engine performance parameters, nominal engine performance graphs such as chamber pressure versus engine thrust, and engine specific impulse versus engine thrust, are often included as additional monitoring aid. Figure 10-7 presents a typical performance graph for the A-1 stage engine system, of chamber pressure versus engine thrust at sea level.
Sample Calculation (10-3)
The following data were obtained from design analyses and component tests of the A-1 stage LOX/RP-1 engine system at nominal rated conditions; i.e., 750000 pounds thrust at sea level:
Thrust chamber sea level specific impulse at 1000-psia nozzle stagnation pressure, and a mixture ratio of Turbine exhaust gas specific impulse sec Oxidizer pump developed head Oxidizer pump overall efficiency percent Fuel pump developed head Fuel pump overall efficiency percent Gas generator mixture ratio Turbine gas available energy content Btu/lb Turbine overall efficiency percent Required auxiliary drive shaft power bhp
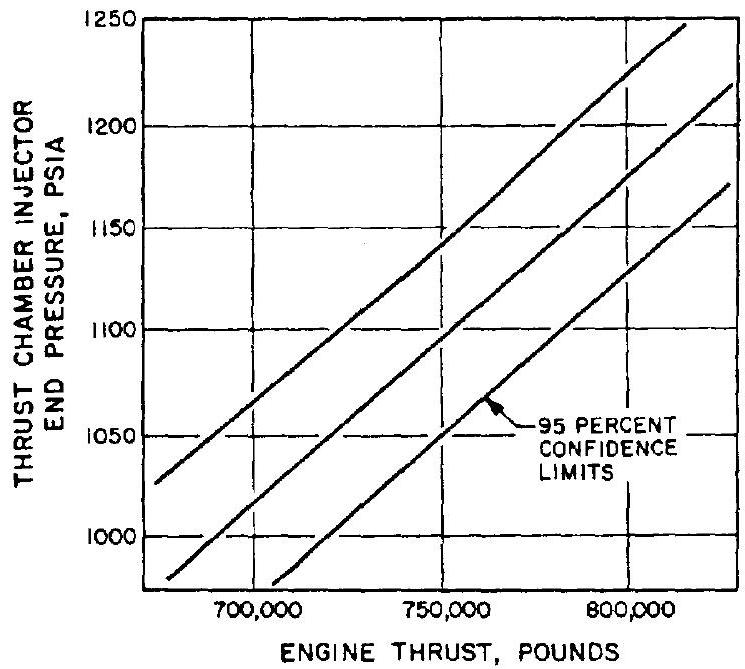 Figure 10-7.-Chamber pressure versus engine thrust at sea level for the A-1 stage engine.
Required oxidizer flow for vehicle tank pressurization Determine the following nominal performance values at rated conditions: (a) Thrust generated by the turbine exhaust gas (b) Thrust generated by the main thrust chamber (c) Engine system propellant flow rates (d) Engine system mixture ratio (e) Engine system specific impulse
Solution
A trial-and-error method is used to solve this problem. Our first step is to approximate engine system and gas generator propellant flow rates. We substitute thrust chamber into equation (1-28):
The thrust chamber mixture ratio can now be used to approximate the corresponding oxidizer and fuel flow rates:
Engine oxidizer flow rate
Oxidizer flow rate Engine fuel flow rate From equations (6-12) and (6-13), the required oxidizer and fuel pump drive horse power for this approximation are:
Oxidizer pump horsepower
Fuel pump horsepower
The corresponding turbine shaft horsepower:
From equation (6-19), the corresponding turbine gas flow rate:
We use this value to start a new calculation cycle to separate main chamber and gas generator data.
The thrust generated by a turbine exhaust gas flow rate of .
Thus the main chamber thrust:
Thrust chamber flow rate
Oxidizer pump flow rate
Fuel pump flow rate
Turbine shaft horsepower
Turbine gas flow rate
We use this value for another calculation trial:
The thrust generated by a turbine exhaust gas flow rate of .
Main chamber thrust Thrust chamber flow rate
Oxidizer pump flow rate
Fuel pump flow rate
Turbine shaft horsepower
Turbine gas flow rate This value closely confirms the assumptions for the last trial. Thus: (a) Nominal turbine exhaust gas thrust
(b) Nominal main thrust chamber thrust
(c) Nominal thrust chamber propellant flow
Nominal engine system propellant flow rate Nominal engine system oxidizer flow rate
Nominal engine system fuel flow rate (d) Nominal engine system O/F mixture ratio (e) Nominal engine specific impulse
Engine Performance Variations Resulting From Off-Nominal Conditions
Engine performance characteristics at various off-nominal conditions must be available to the vehicle system engineer. They can be summarized in the graphic form such as figure 2-1 (engine thrust and specific impulse versus altitude curve), or by means of tabulated engine influence coefficients which will be discussed. The effects of off-nominal conditions of the following engine system performance parameters are considered vital for the design of a vehicle system: (1) Atmospheric pressure (2) Propellant densities (3) Pressures at the engine propellant inlets (4) Propellant mixture ratio and vehicle PU control (5) Vehicle acceleration (6) Throttling of the engine system
Engine Influence Coefficients
These are used to convert or correct steadystate, main-stage engine system performance parameters (dependent variables) from one condition to another of parameters (independent variables) such as atmospheric pressure, fuel temperature, oxidizer density, etc. This may be a correction to standard sea-level conditions (firststage booster engine), or a conversion to other specified conditions. The coefficients are derived from the linearized solution of a set of steady-state differential equations which describe the performance of an engine system. These equations are solved by a digital computer and presented in tabular form, as shown in table 10-1 for the A-1 stage engine system. Each influence coefficient is expressed as a percentage and represents the change of a dependent engine variable, such as thrust, as produced by a 1 -percent change in an independent variable, such as atmospheric pressure. A coefficient preceded by a positive sign ( + ) indicates that an increase of an independent variable produces an increase in the dependent variable. Conversely, a coefficient with a negative sign indicates a decrease in the dependent variable, as a result of independent variable increase. These influence coefficients are usually sufficiently accurate over the entire design operation range of an engine system.
Because the influence coefficients are linear, the total effects of several influences acting simultaneously on an engine system can be determined by summing the individual effects. For example, the change of engine thrust for the A-1 stage engine system (without correction) can be expressed as:
where
Sample Calculation (10-4)
Estimate the thrust of the A-1 stage engine system operated at the following conditions, without considering the effects of correction:
Atmospheric pressure, Oxidizer density, Fuel density, Oxidizer pump inlet suction pressure, psia Fuel pump inlet suction pressure,
Table 10-1. -Influence Coefficient for the A-1 Stage Engine System [Value of correction to be obtained from the correction versus mixture ratio curve shown in fig. 10-8]
| A 1-percent increase of independent variables causes the following percentage change of dependent variables | Independent variables and nominal values | |||||
|---|---|---|---|---|---|---|
| Atmospheric pressure, 14.696 psia | Oxidizer density, | Fuel density, | Oxidizer pump inlet suction pressure, 55 psia | Fuel pump inlet suction pressure, 45 psia | C* correction, 1.0000 | |
| Dependent variables and nominal values: | ||||||
| Engine thrust, 750000 lb | -0.1780 | 1.8750 | -0.7420 | 0.0440 | -0.0066 | 1.1030 |
| Engine specific impulse, 262.4 sec . | - . 1780 | . 2650 | - . 0640 | . 0072 | - . 0150 | 1.1350 |
| Engine mixture ratio. 2.20......... | . 0000 | 1.6420 | -1.3650 | 0270 | - . 0020 | - . 0260 |
| Engine oxidizer flow, . | 0000 | 2.0430 | -1.1120 | 0465 | 0108 | - . 0632 |
| Engine fuel flow, | 0000 | 6530 | . 3120 | 0207 | . 0045 | . 0094 |
Solution
From equation (10-26) and table 10-1:
Engine system thrust of an altitude, where :
Nonlinear Corrections
When the linear approximation is not sufficiently accurate, the usefulness of the engine influence coefficients can be extended by a technique which allows nonlinear corrections for certain parameters. An example of this method is the correction. For instance, a plot of correction versus engine mixture ratio change may be used in conjunction with a table of influence coefficients such as figure 10-8 and table
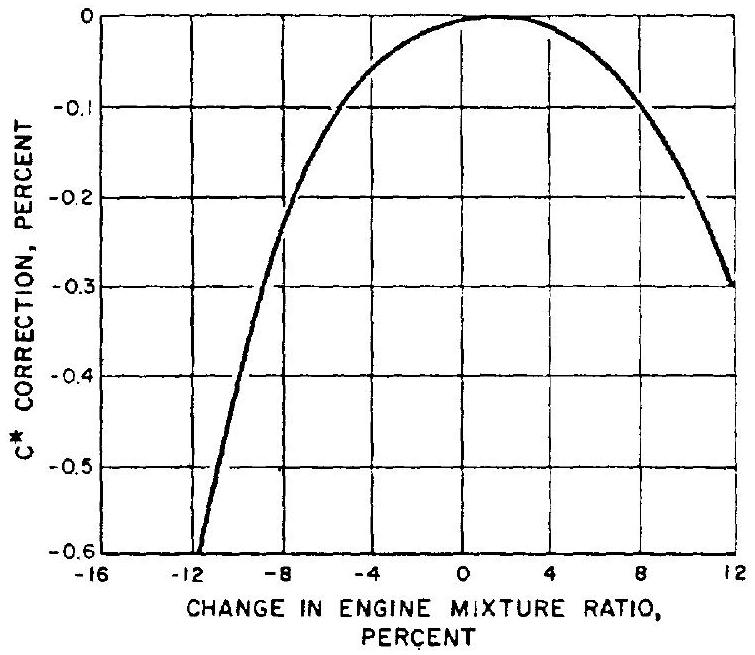 Figure 10-8.-C* correction versus change in engine mixture ratio curve for the A-1 stage engine.
10-1, which are for the A-1 engine system. The change of engine mixture ratio is computed for changes in atmospheric pressure, propellant densities, etc., assuming the correction first to be zero. For the resultant change in engine mixture ratio, the correction is read from the graph. The value of correction found is then used with other independent variables to compute the changes in the remaining dependent variables.
Sample Calculation (10-5)
Estimate the thrust of the A-1 stage engine system operated at the conditions listed for sample calculation (10-4), adding the effects of correction. Also, for the same conditions, estimate the thrust assuming an additional mixture ratio error of +10 percent, due to faulty calibration.
Solution
By analogy with equation (10-26) and using table 10-1, the engine system mixture ratio change due to the conditions of sample calculation (10-4) are determined as
From figure 10-8, the correction for a mixture ratio change of -1.62 percent is approximately -0.02 percent. From table , the influence coefficient for engine system thrust is 1.1030 , for a 1 percent correction. Thus Percent change in
Therefore, engine system thrust considering effects of correction:
If the mixture ratio error of 10 percent is added, the total mixture ratio change percent. From figure 10-8, the correction then is approximately -0.11 percent.
Thus
Engine system thrust: